Neonatology
Session: Neo-Perinatal Health Care Delivery 1: Epidemiology/Health Services Research
324 - Trends in Admissions and Costs Associated with Neonatal Intensive Care in US Children’s Hospitals, 2017-2022
Saturday, May 4, 2024
3:30 PM - 6:00 PM ET
Poster Number: 324
Publication Number: 324.1583
Publication Number: 324.1583

Ashlee Vance, PhD, MA, RN, RNC-NIC (she/her/hers)
Assistant Scientist
Henry Ford Health
Detroit, Michigan, United States
Presenting Author(s)
Background: Advances in technology and improvements in clinical care have impacted the landscape of neonatal intensive care. Yet, recent estimates for the volume and costs of NICU admissions in US Children’s Hospitals are lacking.
Objective: To describe trends and costs of NICU admissions among US Children’s Hospitals from 2017-2022 by gestational age and medical complexity.
Design/Methods: Retrospective cohort study using data from Pediatric Health Information System (PHIS), which includes data from 48 US Children’s Hospitals. ICD-10 codes were used to identify diagnoses; the Complex Chronic Conditions Classification System was used to identify infants with medical complexity. Illness severity was measured using an adapted H-RISK score for hospitalization resource intensity. Logistic regression modeling with year modeled as a continuous variable was used to evaluate trends for categorical variables; for continuous variables, trends were assessed using log-linear models. Costs were inflated to 2022 USD using the hospital inpatient component of the producer price index.
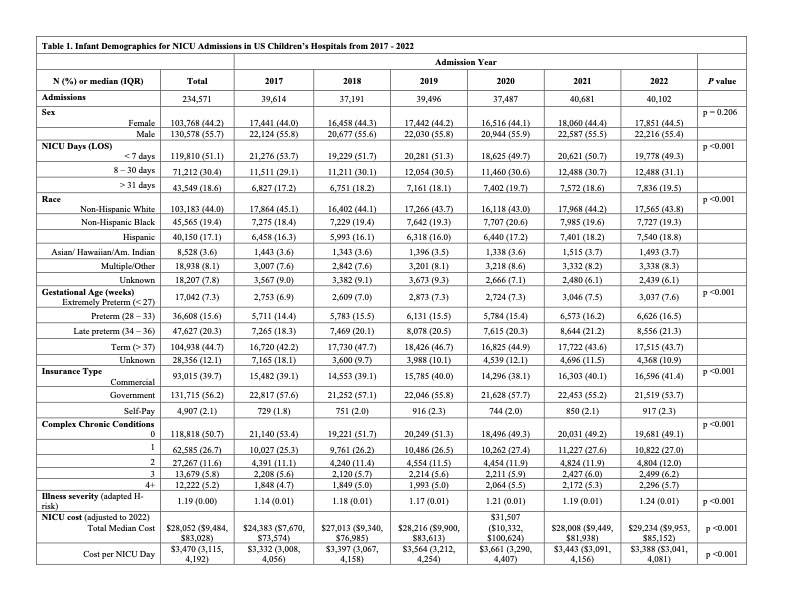
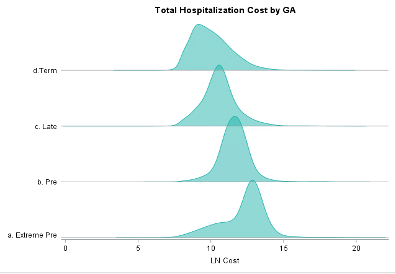
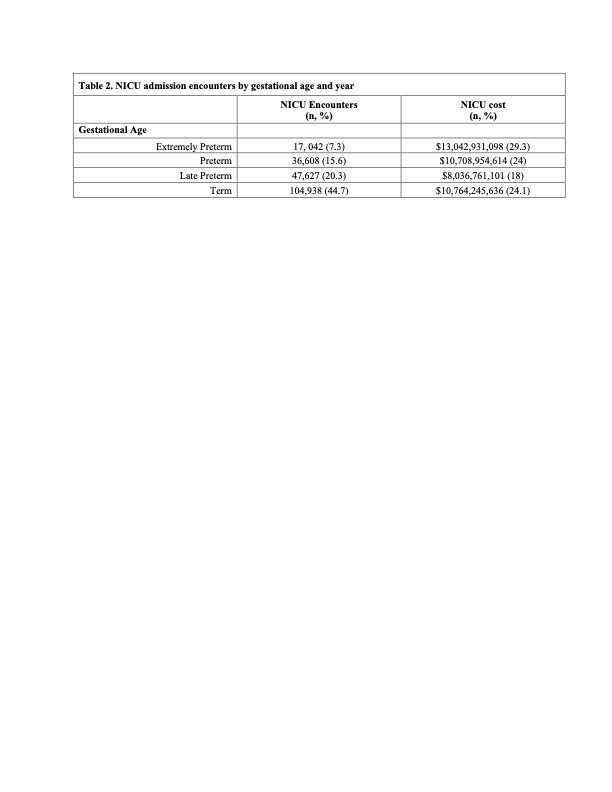
Results: 234,571 infants were admitted to a Children’s Hospital NICU and discharged between 2017 – 2022. Several patient demographics significantly changed over time including length of stay, NICU days, race, gestational age, insurance, illness severity, and chronic conditions (p < 0.001) (Table 1). The proportion of infants admitted to the NICU for > 30 days significantly increased over time from 17% in 2017 to 19.5% in 2022 (p < 0.001). The Illness Severity Risk score increased over time from 1.14 in 2017 to 1.24 in 2022 (p < 0.01). Additionally, NICU costs increased through 2019, then leveled off between 2020 and 2022. The median cost of a NICU admission, in 2017, was $24,383 (IQR: $7,670, $76,985) compared to $29,234 (IQR: $9,953, $85,152) in 2022 (p < 0.001). Total hospital costs, in 2022, were highest for those born extremely preterm, with an average cost per admission of $275,745 compared to $15,341 for term-born infants (Fig 1 Ridge plot). NICU admissions accounted for ~6% of children’s hospital admissions, but resulted in more than 21% of hospital costs. Specifically, extremely preterm infant accounted for 7% of admissions but 29% of costs compared to 45% of term infant admissions and 24% of costs (Table 2).
Conclusion(s): We observed increasing trends in length of stay, illness severity, and costs for NICU admissions between 2017 and 2022 in US Children’s Hospitals. Further studies are needed that explore factors contributing to higher and lowers costs such as allocation of resources and clinical care by gestational age and/or medical complexity.


