Infectious Diseases
Session: Infectious Diseases 3
129 - Multivariate Analysis of Correlated Immunological Biomarker Variables: Dimension Reduction and Predictive Models
Sunday, May 5, 2024
3:30 PM - 6:00 PM ET
Poster Number: 129
Publication Number: 129.2245
Publication Number: 129.2245
- MB
Michael Brimacombe, BA MA MSc PhD
Senior Advisory Biostatistician, Associate Professor
CT Childrens
Presenting Author(s)
Background: Multivariate biomarker structures are an important component in understanding the onset of infection triggered conditions such as multisystem inflammatory syndrome in children (MIS-C). The development of related multivariate predictive models are complicated by the correlated nature of many significant immunological cytokine responses.
Objective: Develop a predictive classification model incorporating adjusted pairwise individual biomarker significance, effect size, and correlations among the significant biomarkers to give an interpretable and predictive logistic regression model for the onset of MIS-C versus healthy controls with moderate sample sizes.
Design/Methods: Subjects included were; birth to ≤21 years old and with serum samples available, enrolled in a prospective study with a primary aim of identifying a diagnostic biosignature for MIS-C. Patients were randomly recruited and placed in one of 5 diagnostic groups upon clinical review. Initial 1-way ANOVA and adjusted pairwise comparisons were used to detect individually significant biomarkers, testing across the set of patient groups, adjusting for multiple comparisons. Specific pairwise comparison (MIS-C versus controls) was of interest and several biomarkers found to be significant and highly correlated. Dimension reduction was applied to these biomarkers in the form of principal components analysis (PCA). A logistic regression model based on the first two PCA variables provided a highly predictive classification model.
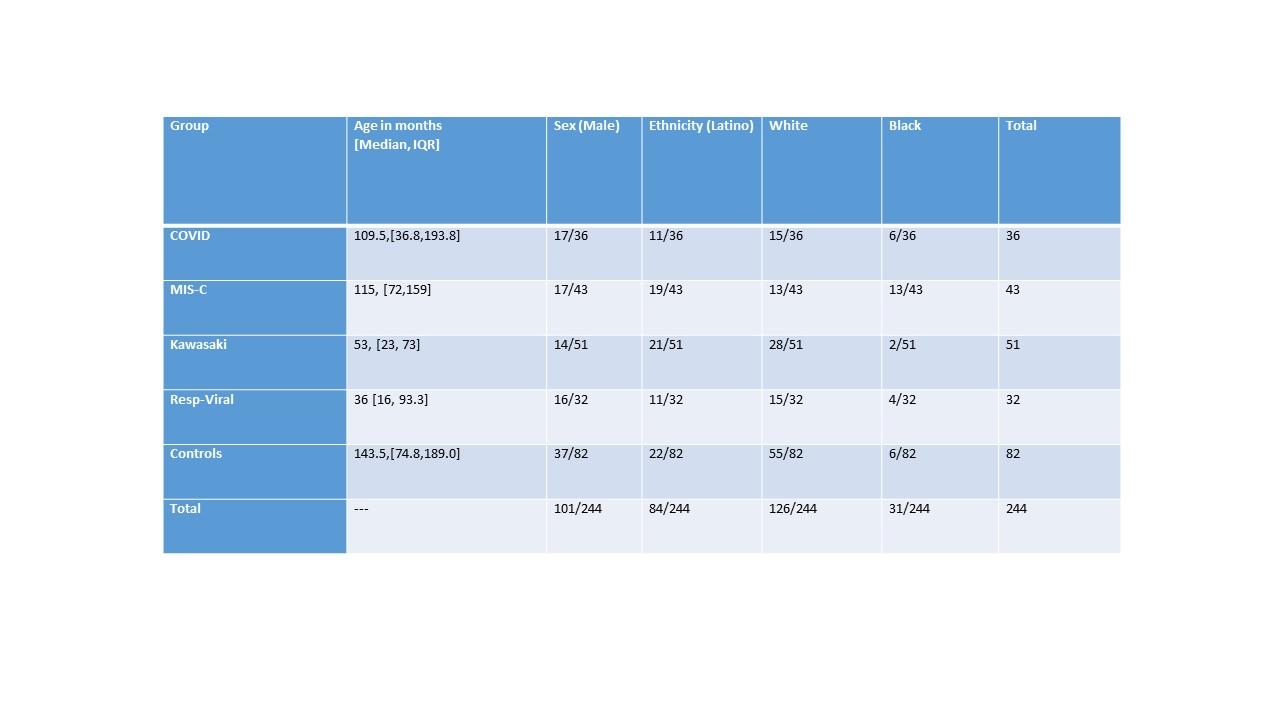
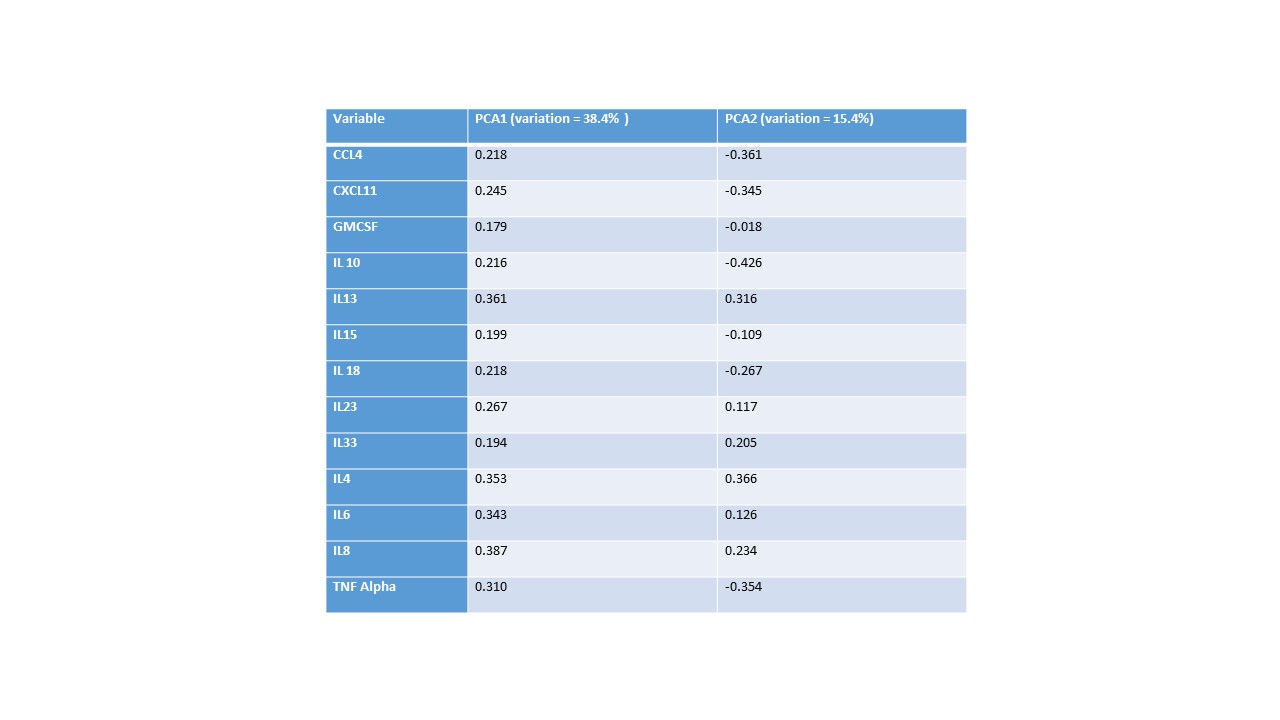
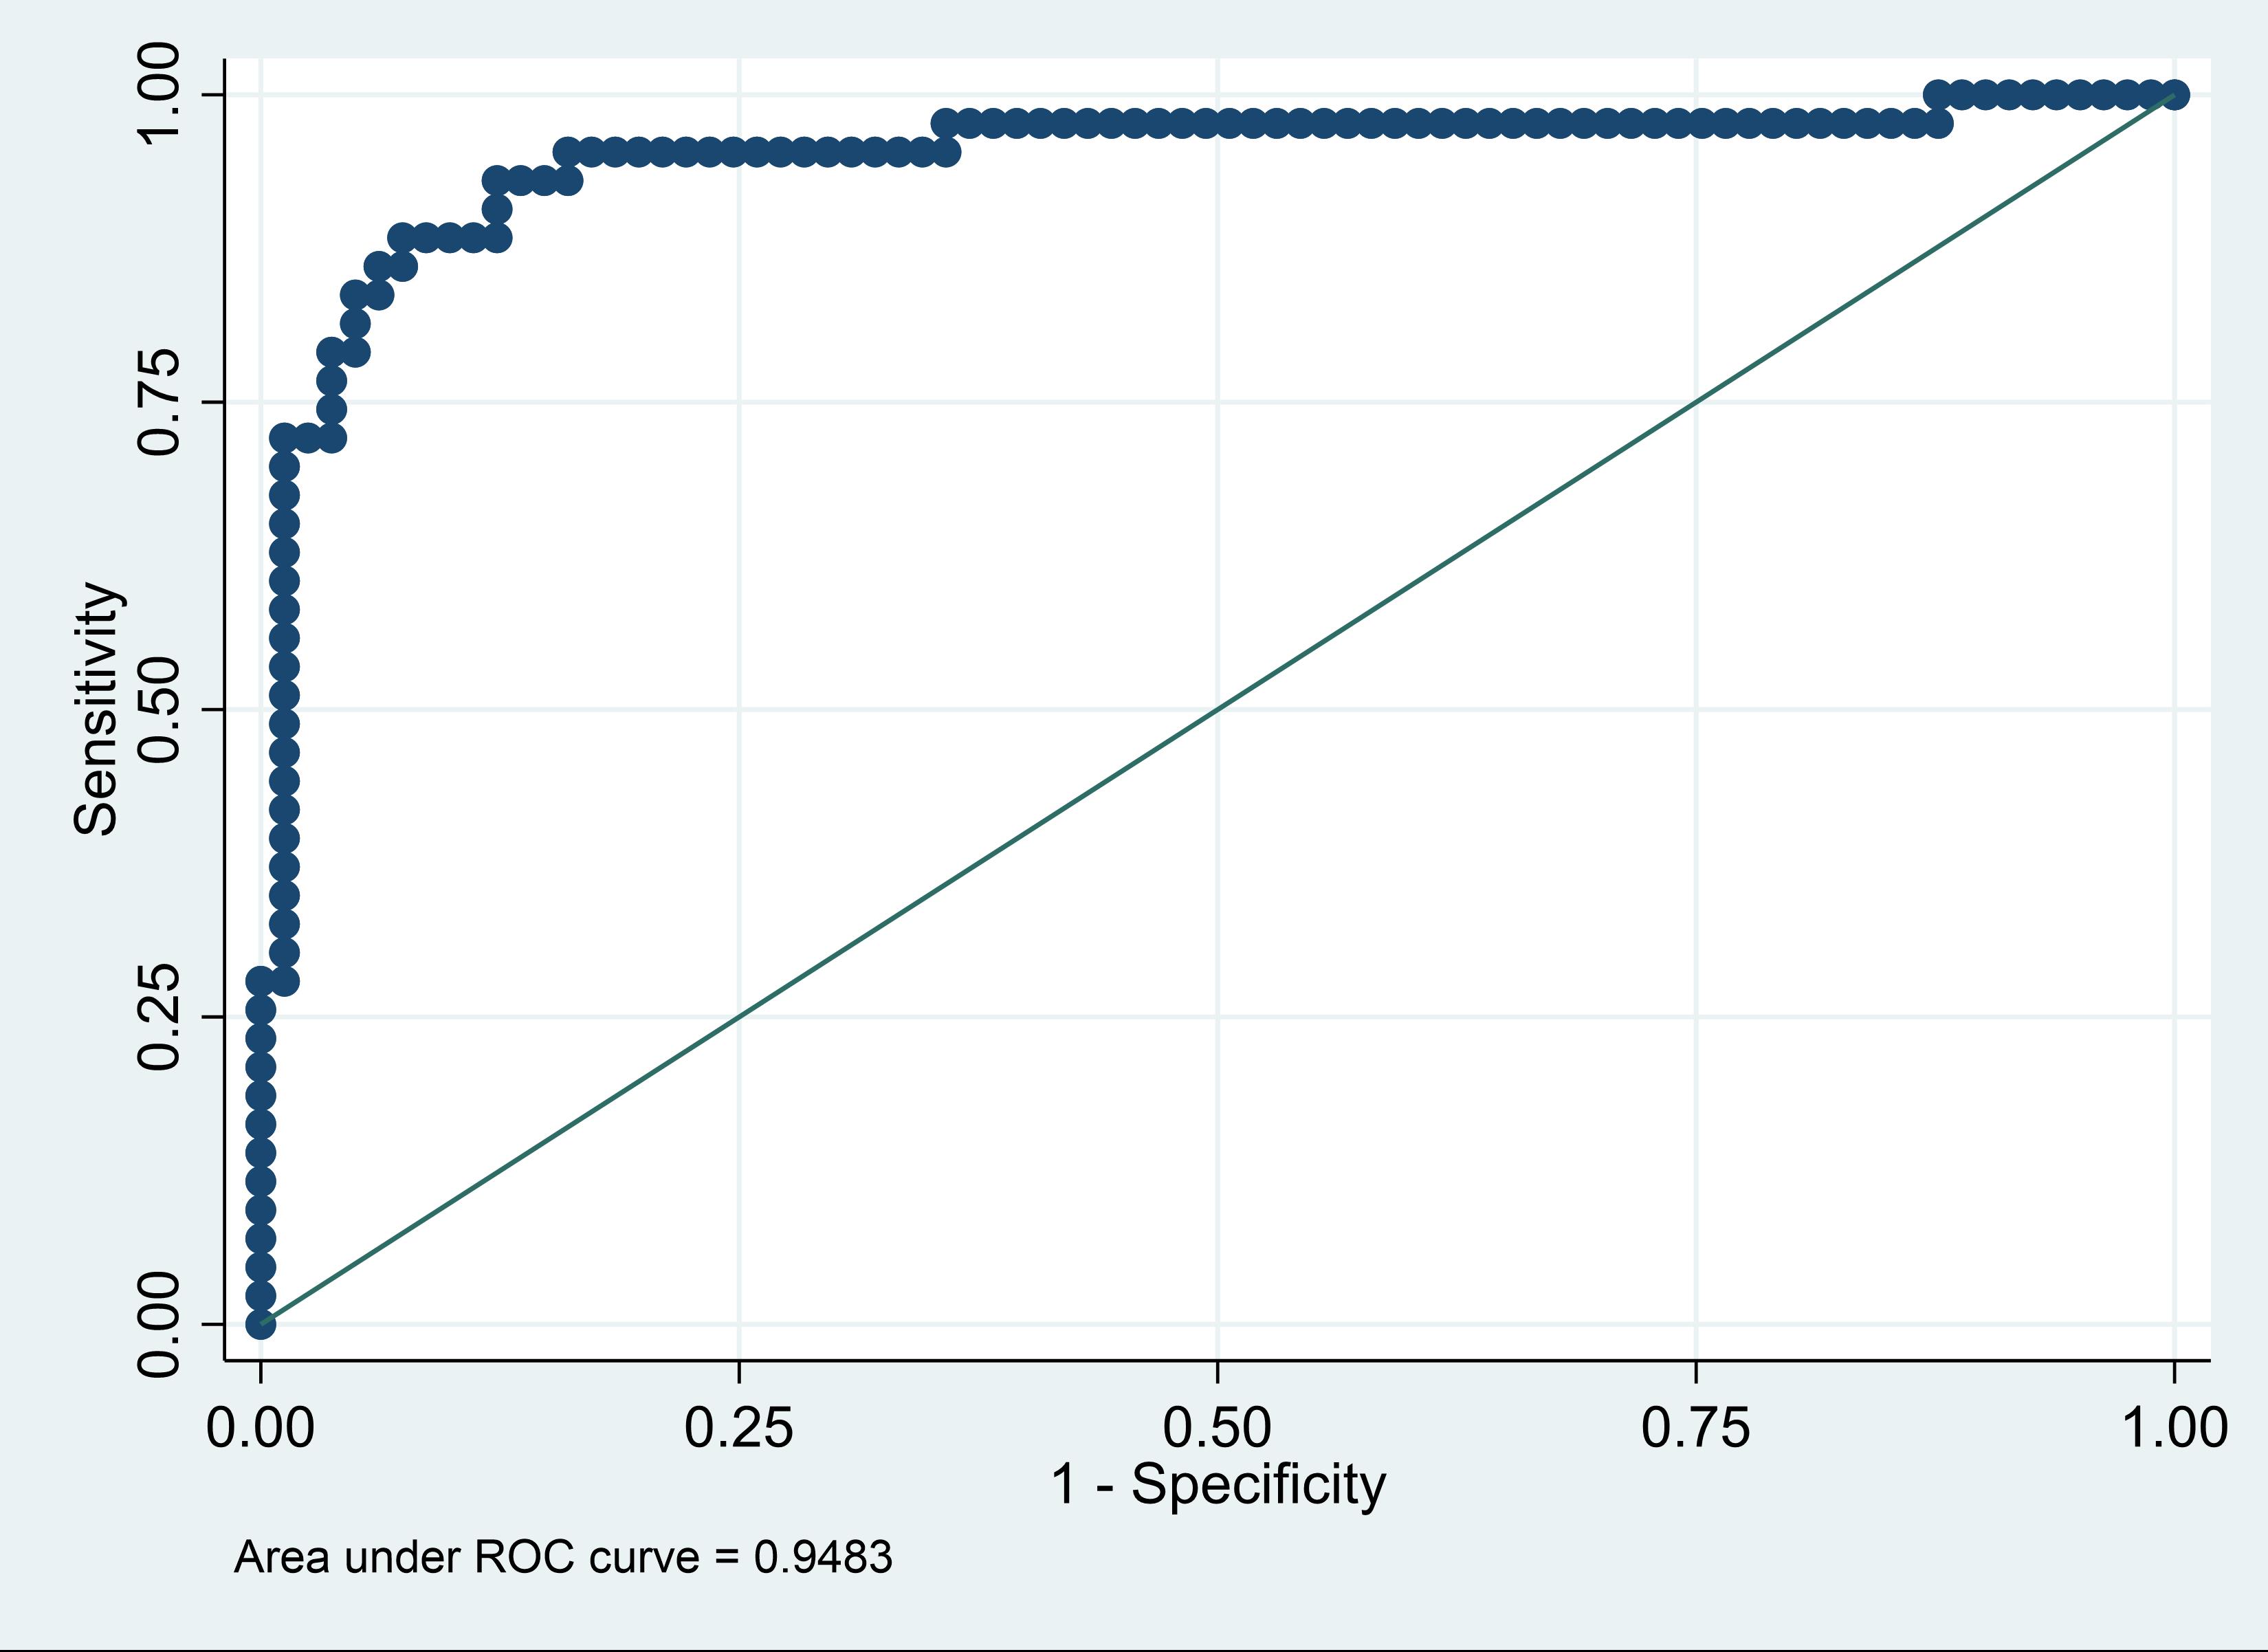
Results: Table 1 shows the demographics of the patient groups. Twenty-six standard immunological biomarker responses were examined. Differences across patient groups were tested using 1-way ANOVA with Tukey adjusted pairwise comparisons and 13 biomarkers were found to be significant regarding pairwise comparison of MIS-C versus healthy controls. Principal components based dimension reduction was then applied with the first two PCA variables accounting for 53.8% of total variation. See Table 2. The resulting logistic regression model for prediction of a MIS-C diagnosis based on the first two PCA variables gave: Sensitivity= 83.7%, Specificity= 95.1%, Positive predictive value= 90.0%, Negative predictive value= 91.7%, False + rate= 4.9%, False – rate= 16.3%, Overall Correctly classified= 91.1%, AUC = 94.8% (Figure 1).
Conclusion(s): Correlation based information can be incorporated with standard univariate pairwise comparison methods to obtain useful predictive classification models for MIS-C versus healthy controls. Future work includes development of biomarker based predictive models for differentiating Kawasaki versus MIS-C.


