Infectious Diseases
Session: Infectious Diseases 2
63 - Correspondence Analysis in Multivariate Symptomology: Visualizing Symptom Clusters and Reported Conditions in COVID Related Patients
Saturday, May 4, 2024
3:30 PM - 6:00 PM ET
Poster Number: 63
Publication Number: 63.1115
Publication Number: 63.1115
- MB
Michael Brimacombe, BA MA MSc PhD
Senior Advisory Biostatistician, Associate Professor
CT Childrens
Presenting Author(s)
Background: The study of symptoms and reported conditions is used by clinicians to guide the development of treatments and develop diagnoses. The occurrence of many individual symptoms and conditions are correlated, though they are typically measured, reported and interpreted on an individual basis.
Objective: The visualization of multivariate symptom/condition patterns in relation to patient groups defined in a MIS-C related NIH study. Correspondence analysis was applied to demonstrate how complex symptom patterns can be visually interpreted relative to diagnostic conditions, and how such patterns alter in relation to specific treatment interventions.
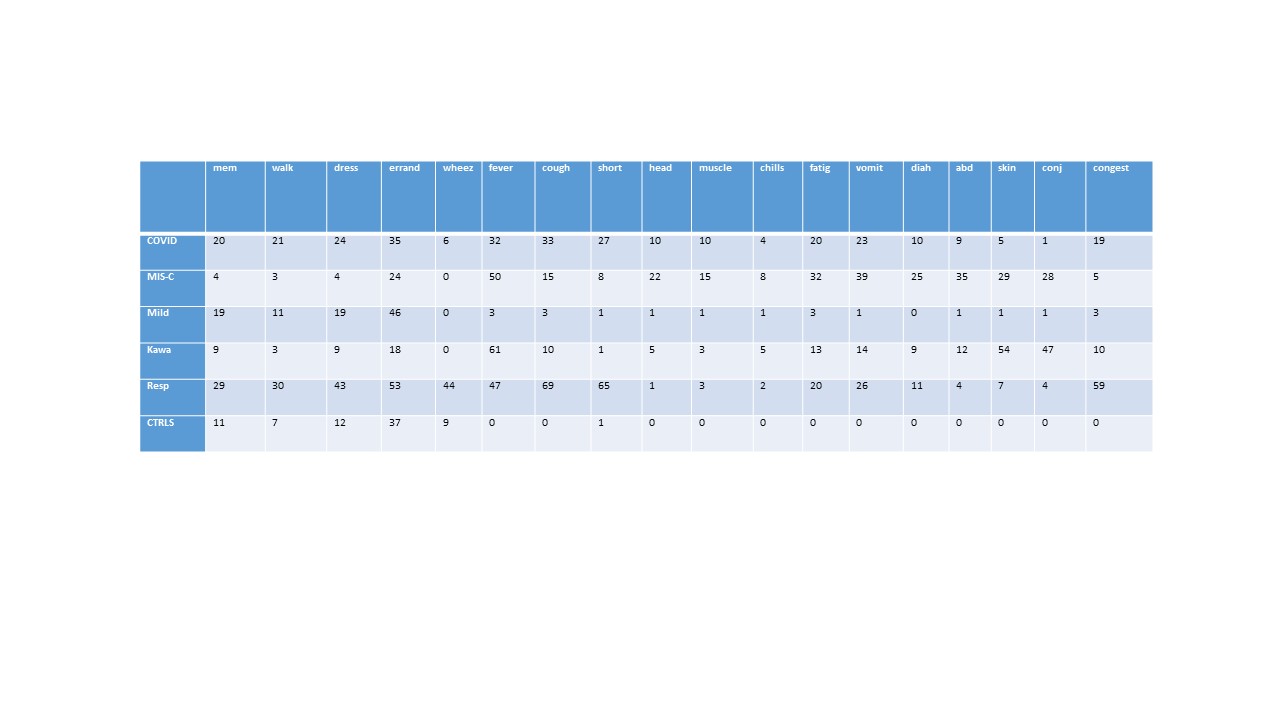
Design/Methods: Patients were recruited and placed in one of 6 patient groups (COVID+, MIS-C, Mild, Respiratory-Viral, Kawasaki disease and healthy controls). Subjects included; birth to ≤21 years old, enrolled in a prospective study with a primary aim of identifying a diagnostic biosignature for MIS-C. Patient membership in a diagnostic group was adjudicated by a panel of 3 pediatric clinicians. Eighteen COVID and respiratory related symptoms and self-reported conditions were selected to study in relation to patient groups. These were expressed in a cross-tabulated table of counts and correspondence analysis (CA) applied to graphically examine how symptoms/conditions related to diagnostic groups.
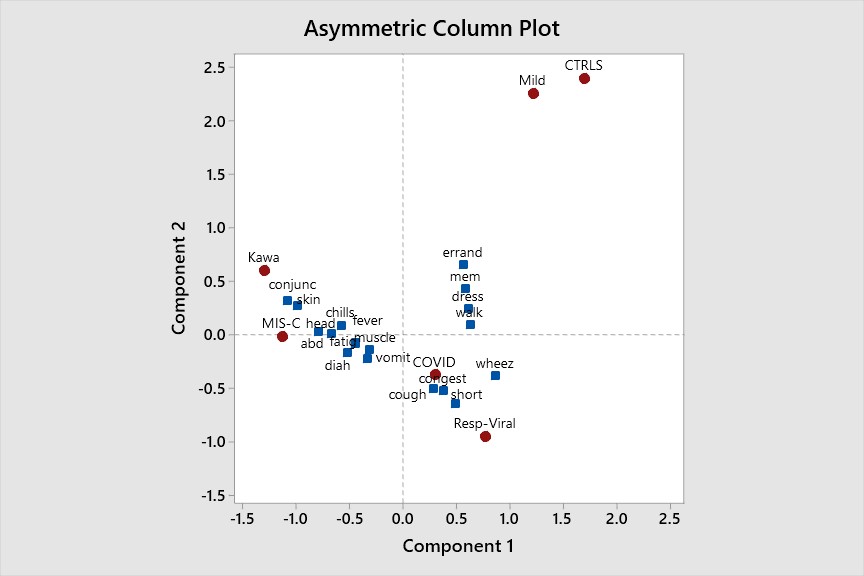
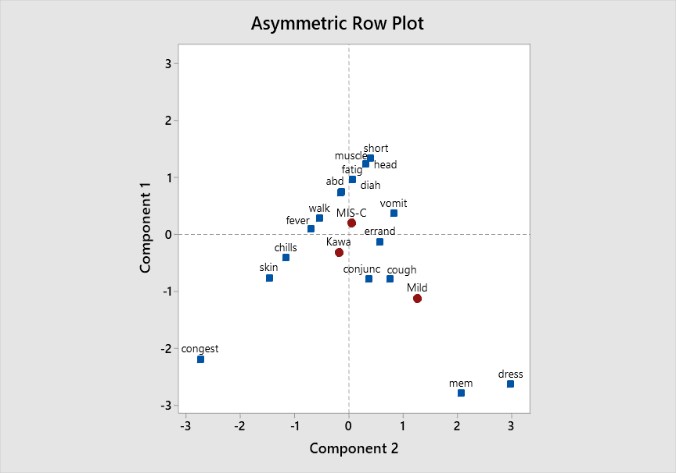
Results: Table 1 gives a breakdown of 18 standard respiratory and COVID related symptoms and conditions, across the 6 patient groups. Four of these (memory loss, walking, dressing and errands) were self-report. The rest were abstracted from hospital records. Figure 1 shows nodes representing patient groups and their proximity to the various symptoms. These distances can be interpreted with higher levels of association reflected by closer proximity. Here, severity of the groups increases from right to left and severity of symptoms approximately from north to south. The close overlap of MIS-C and Kawasaki is apparent with skin rash and conjunctivitis related primarily to Kawasaki disease. Figure 2 shows symptom patterns for the same cohort, symptoms and conditions when patients are given Intravenous Immunoglobulin IVIg, a common treatment for MIS-C and Kawasaki patients. Symptom patterns alter considerably when compared to Figure 1.
Conclusion(s): Symptom prevalence data can be visualized in relation to patient diagnostic groups in a very informative manner. This is especially useful in examining symptomology in very large databases, where significant testing is limited. Changes in cluster patterns as a function of time, treatments or age can be visualized and interpreted.


