Public Health & Prevention
Session: Public Health & Prevention 1
205 - Pediatric BMI z-score changes following implementation of a sweetened beverage tax in Philadelphia
Saturday, May 4, 2024
3:30 PM - 6:00 PM ET
Poster Number: 205
Publication Number: 205.1498
Publication Number: 205.1498
- EG
Emily F. Gregory, MD, MHS (she/her/hers)
Assistant Professor
Children's Hospital of Philadelphia
Philadelphia, Pennsylvania, United States
Presenting Author(s)
Background: The Philadelphia beverage tax, implemented 1/1/2017, taxes sugar-sweetened beverages, a major source of excess sugar consumption in the US. The tax was associated with declines in taxed beverage sales and decreased sweetened beverage consumption among high school students.
Objective: Assess whether the Philadelphia beverage tax was associated with changes in pediatric BMI z-score.
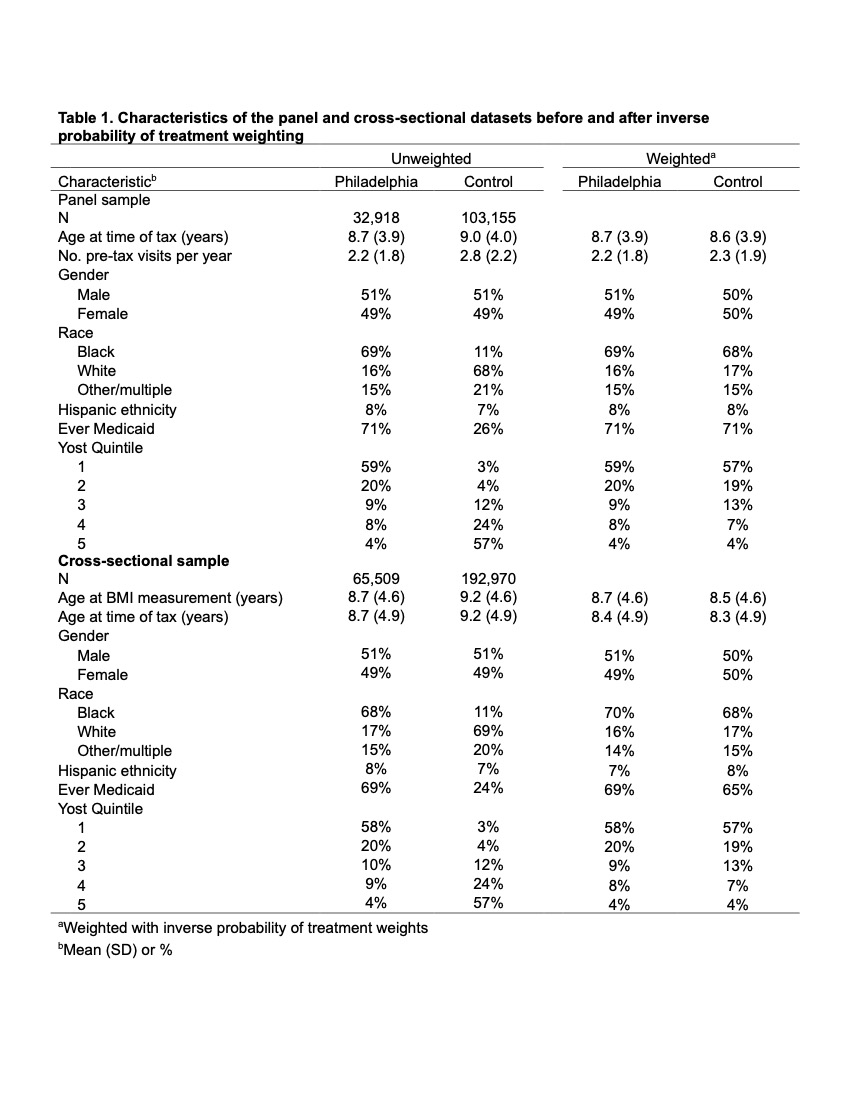
Design/Methods: This difference-in-differences study used electronic health records from a pediatric health system to examine BMI z-score changes for Philadelphia youth (exposed to tax) versus youth in adjacent suburbs (control) from 2014 – 2019. In a panel analysis, we included youth aged 2 – 17 with >=1 BMI recorded in the pre-tax period (2014 – 2016) and >=1 in the post-tax period (2018 – 2019). In cross-sectional analysis, we included youth aged 2 – 17 years with a BMI recorded any time from 2014 – 2019. Both analyses used inverse-probability weighting to adjust for differences between groups in age, sex, race, ethnicity, Medicaid insurance, and a census tract socioeconomic index (Table 1). We used mixed effects linear regression models to estimate post-tax changes in BMI z-score.
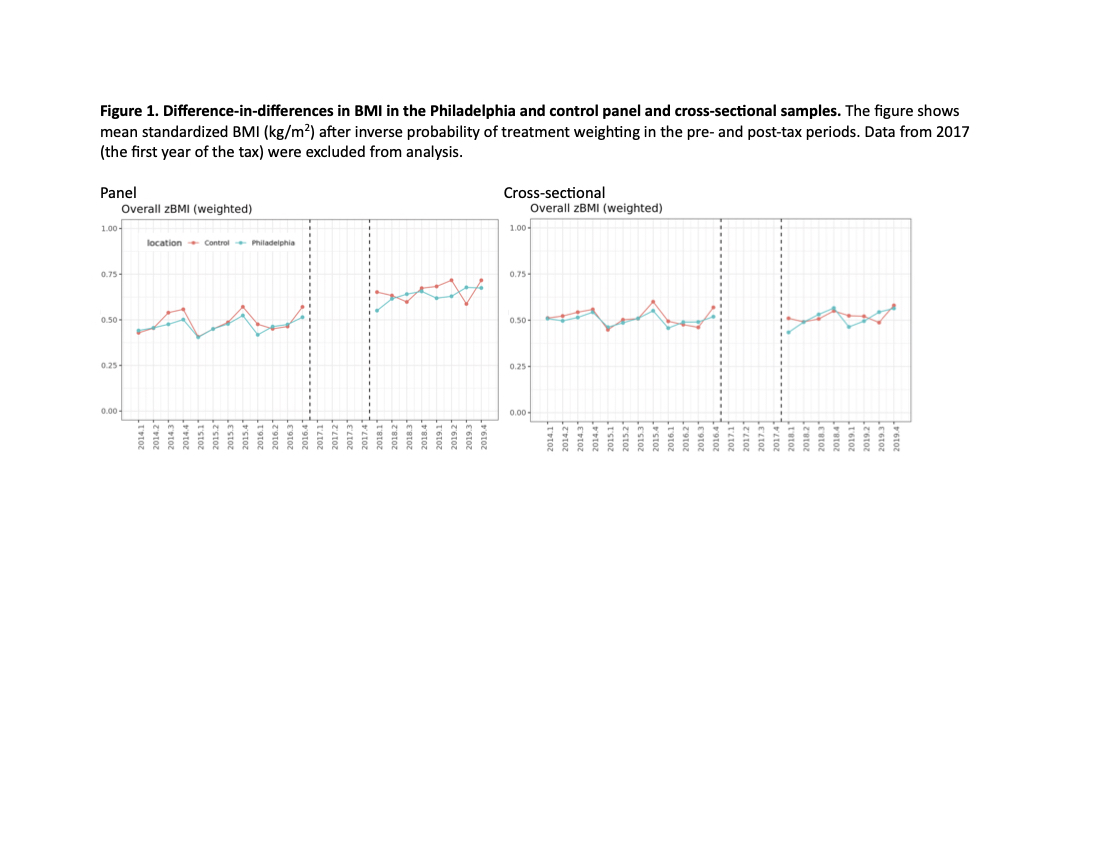
Results: In both the panel analysis of 136,073 youth and the cross-sectional analysis of 258,579 youth, there was no change in BMI z-score in the 2-year post period for Philadelphia residents vs. those in non-taxed area (panel -0.001 BMI z-score change, 95% CI -0.006, 0.004, p=0.67; cross-sectional -0.002, 95% CI -0.007, 0.003, p=0.34). In subgroup analyses, the tax was associated with a decrease in BMI z-score for youth with White race (panel -0.032, 95% CI -0.038, -0.025; cross-sectional -0.016, 95% CI -0.022, -0.010) while Black youth had an increased z-score (panel 0.005, 95% CI 0.004, 0.026) or no change (cross-sectional -0.004, 95% CI -0.014, 0.006). Panel analysis allowed us to assess changes in those with baseline overweight/obesity, for whom we found decreased BMI z-score (-0.013, 95% CI -0.020, -0.005). Cross-sectional analysis allowed us to assess differences by age. For ages 6 – 12, we saw an increased z-score (0.022, 95% CI 0.016, 0.029), and for ages 13 – 18 a decreased z-score (-0.026, 95% CI -0.035, -0.017).
Conclusion(s): The Philadelphia beverage tax was not associated with BMI z-score change in this analysis. Though certain subgroups demonstrated small statistically significant changes in BMI, they are likely of low clinical significance.


