Health Services Research
Session: Health Services Research 2: Novel Methods and Disparities
307 - Identifying and Mapping Bronchiolitis Clusters in Connecticut
Saturday, May 4, 2024
3:30 PM - 6:00 PM ET
Poster Number: 307
Publication Number: 307.1302
Publication Number: 307.1302

Alexander H. Hogan, MD, MS (he/him/his)
Assistant Professor of Pediatrics
Connecticut Children's
Hartford, Connecticut, United States
Presenting Author(s)
Background: The recent approval of a respiratory syncytial virus (RSV) vaccine and monoclonal antibody (nirsevimab) holds promise for bronchiolitis morbidity prevention. There is an urgency to pinpoint regions disproportionately affected by such morbidity to enhance communication campaigns and immunization deployment.
Objective: Identify geographical clusters of bronchiolitis acute care discharges across an entire state (Connecticut, CT).
Design/Methods: We conducted a retrospective cohort study using the CT-wide ChimeData administrative database. We identified encounters for children under two years of age discharged from emergency departments and/or hospitals following inpatient stays. We evaluated encounters across four periods evenly split from March 2018 – February 2022 to account for bronchiolitis seasonality and the impact of COVID-19. Included children had to have been discharged with either a primary or secondary diagnosis of bronchiolitis (J21.0, J21.1, J21.8, J21.9). For each included encounter, we geocoded home addresses to the ZIP Code Tabulation Areas (ZCTAs). Next, we obtained pediatric population estimates per ZCTA from the American Community Survey and calculated case rates per ZCTA per 100 children. We assessed for geographical clustering using Moran’s I and Getis-Ord (Gi*) statistics. We used the Poisson Space-Time Scan (SaTScan) to analyze clustering across time and space.
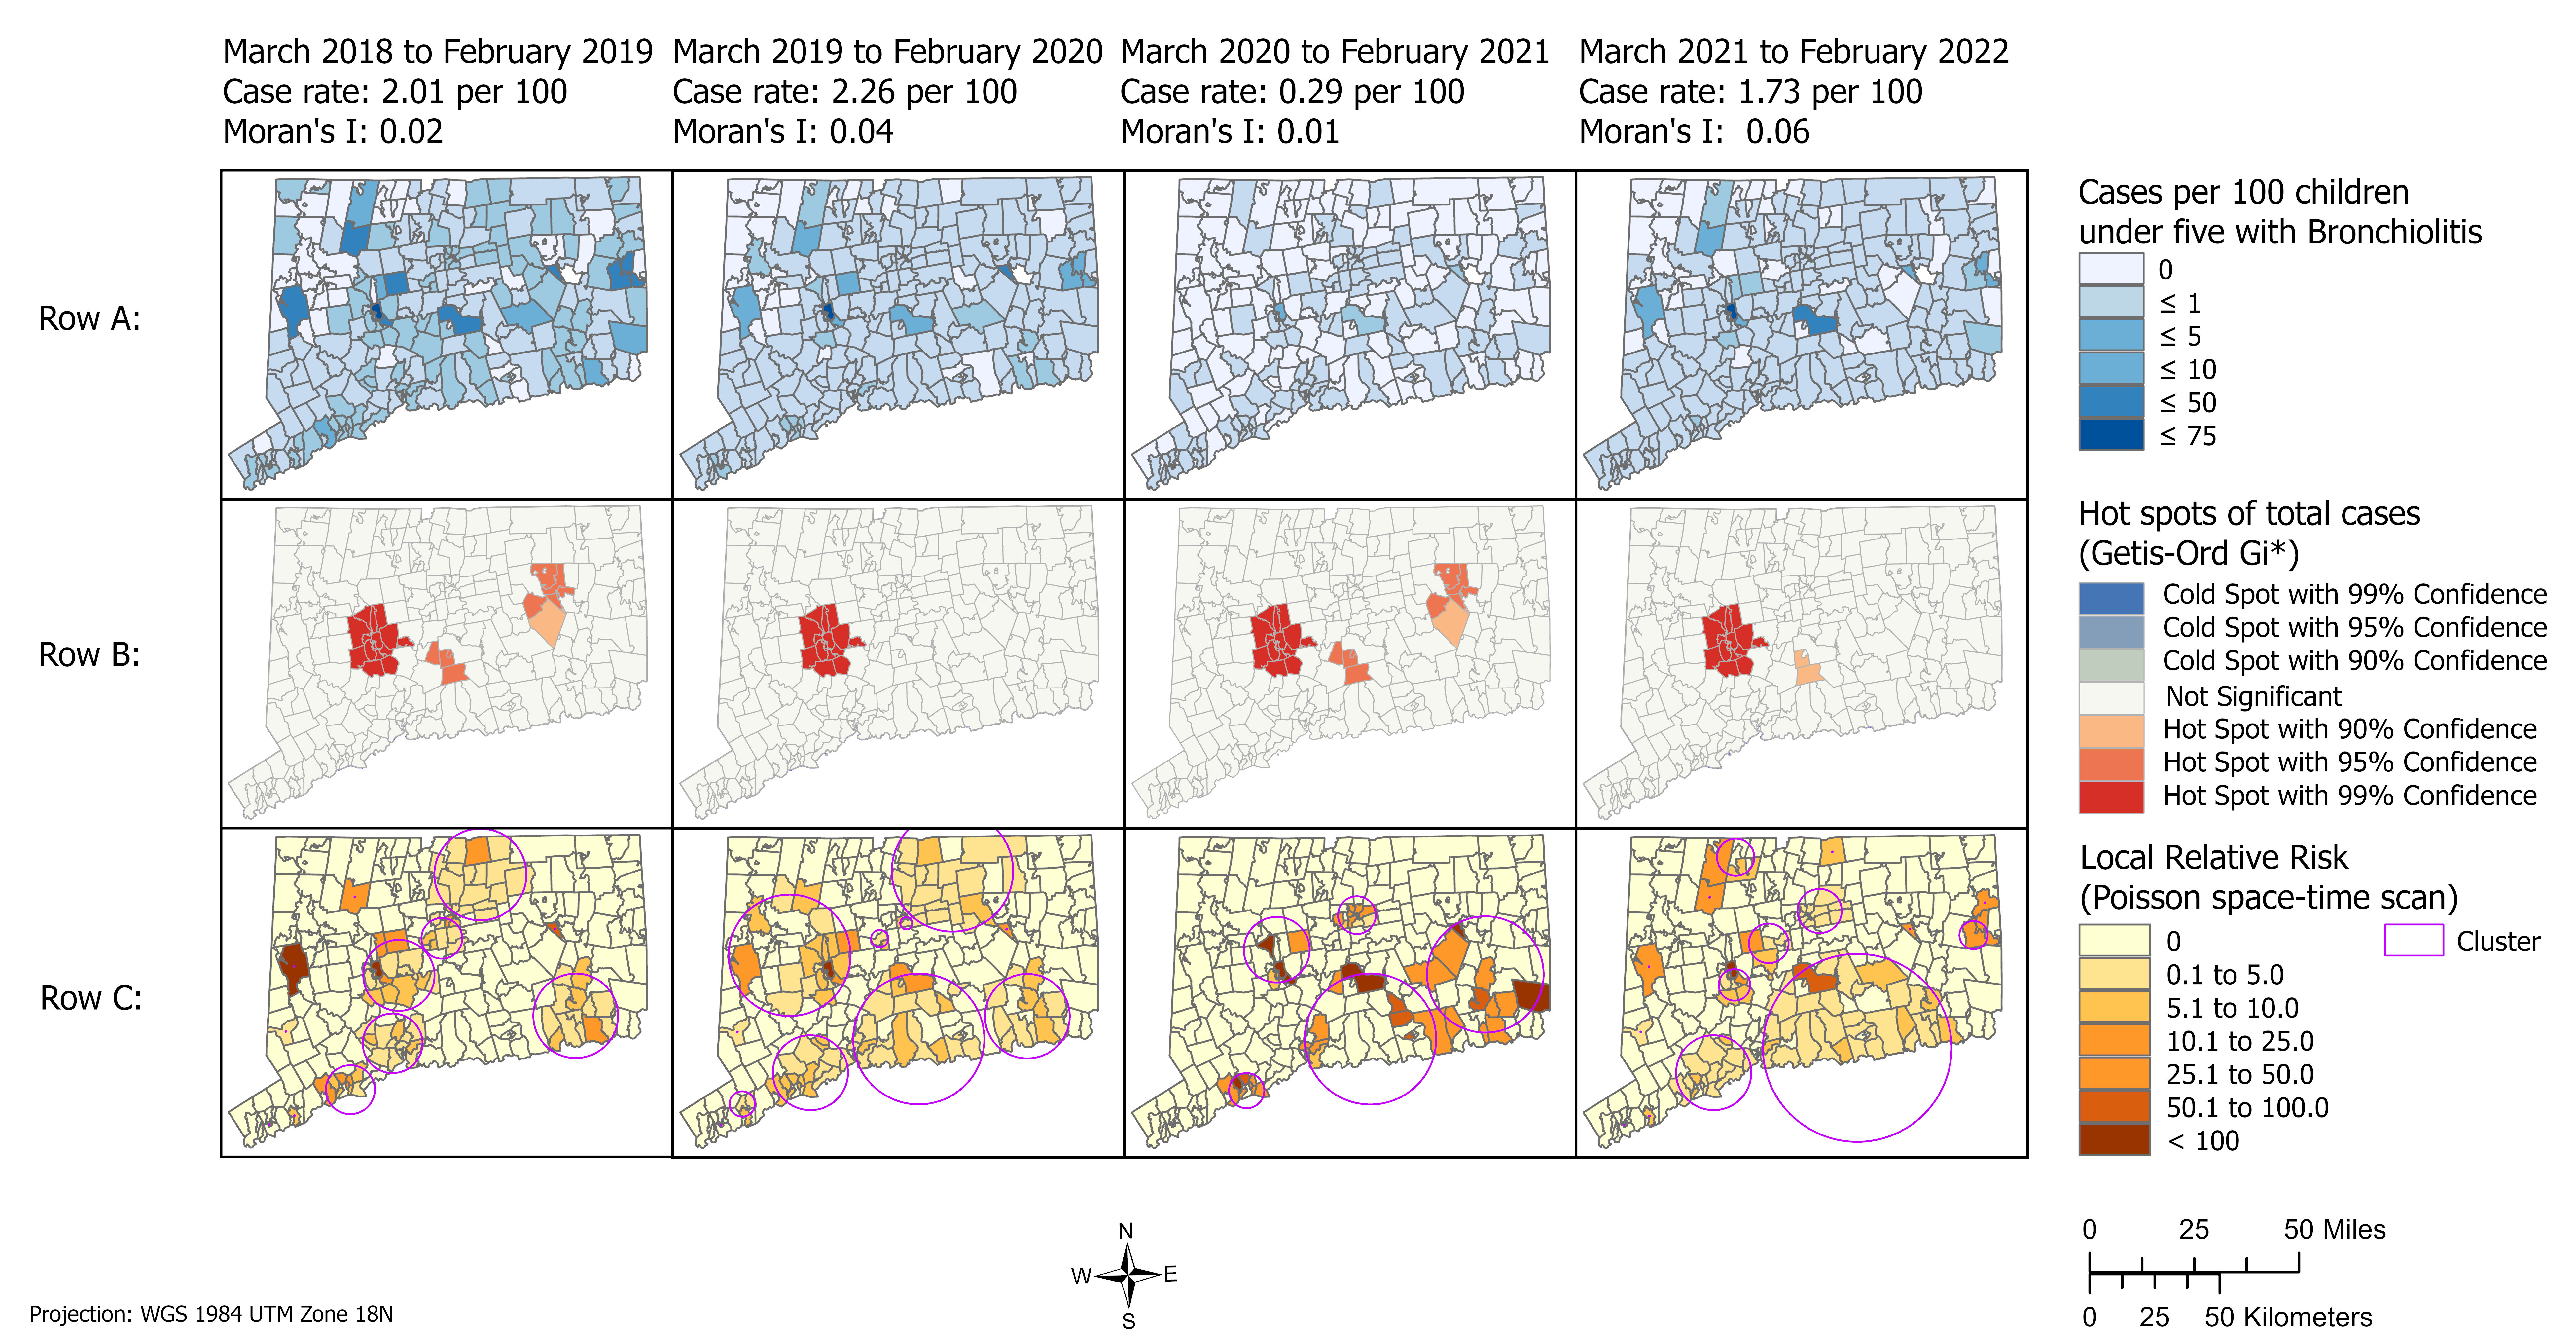
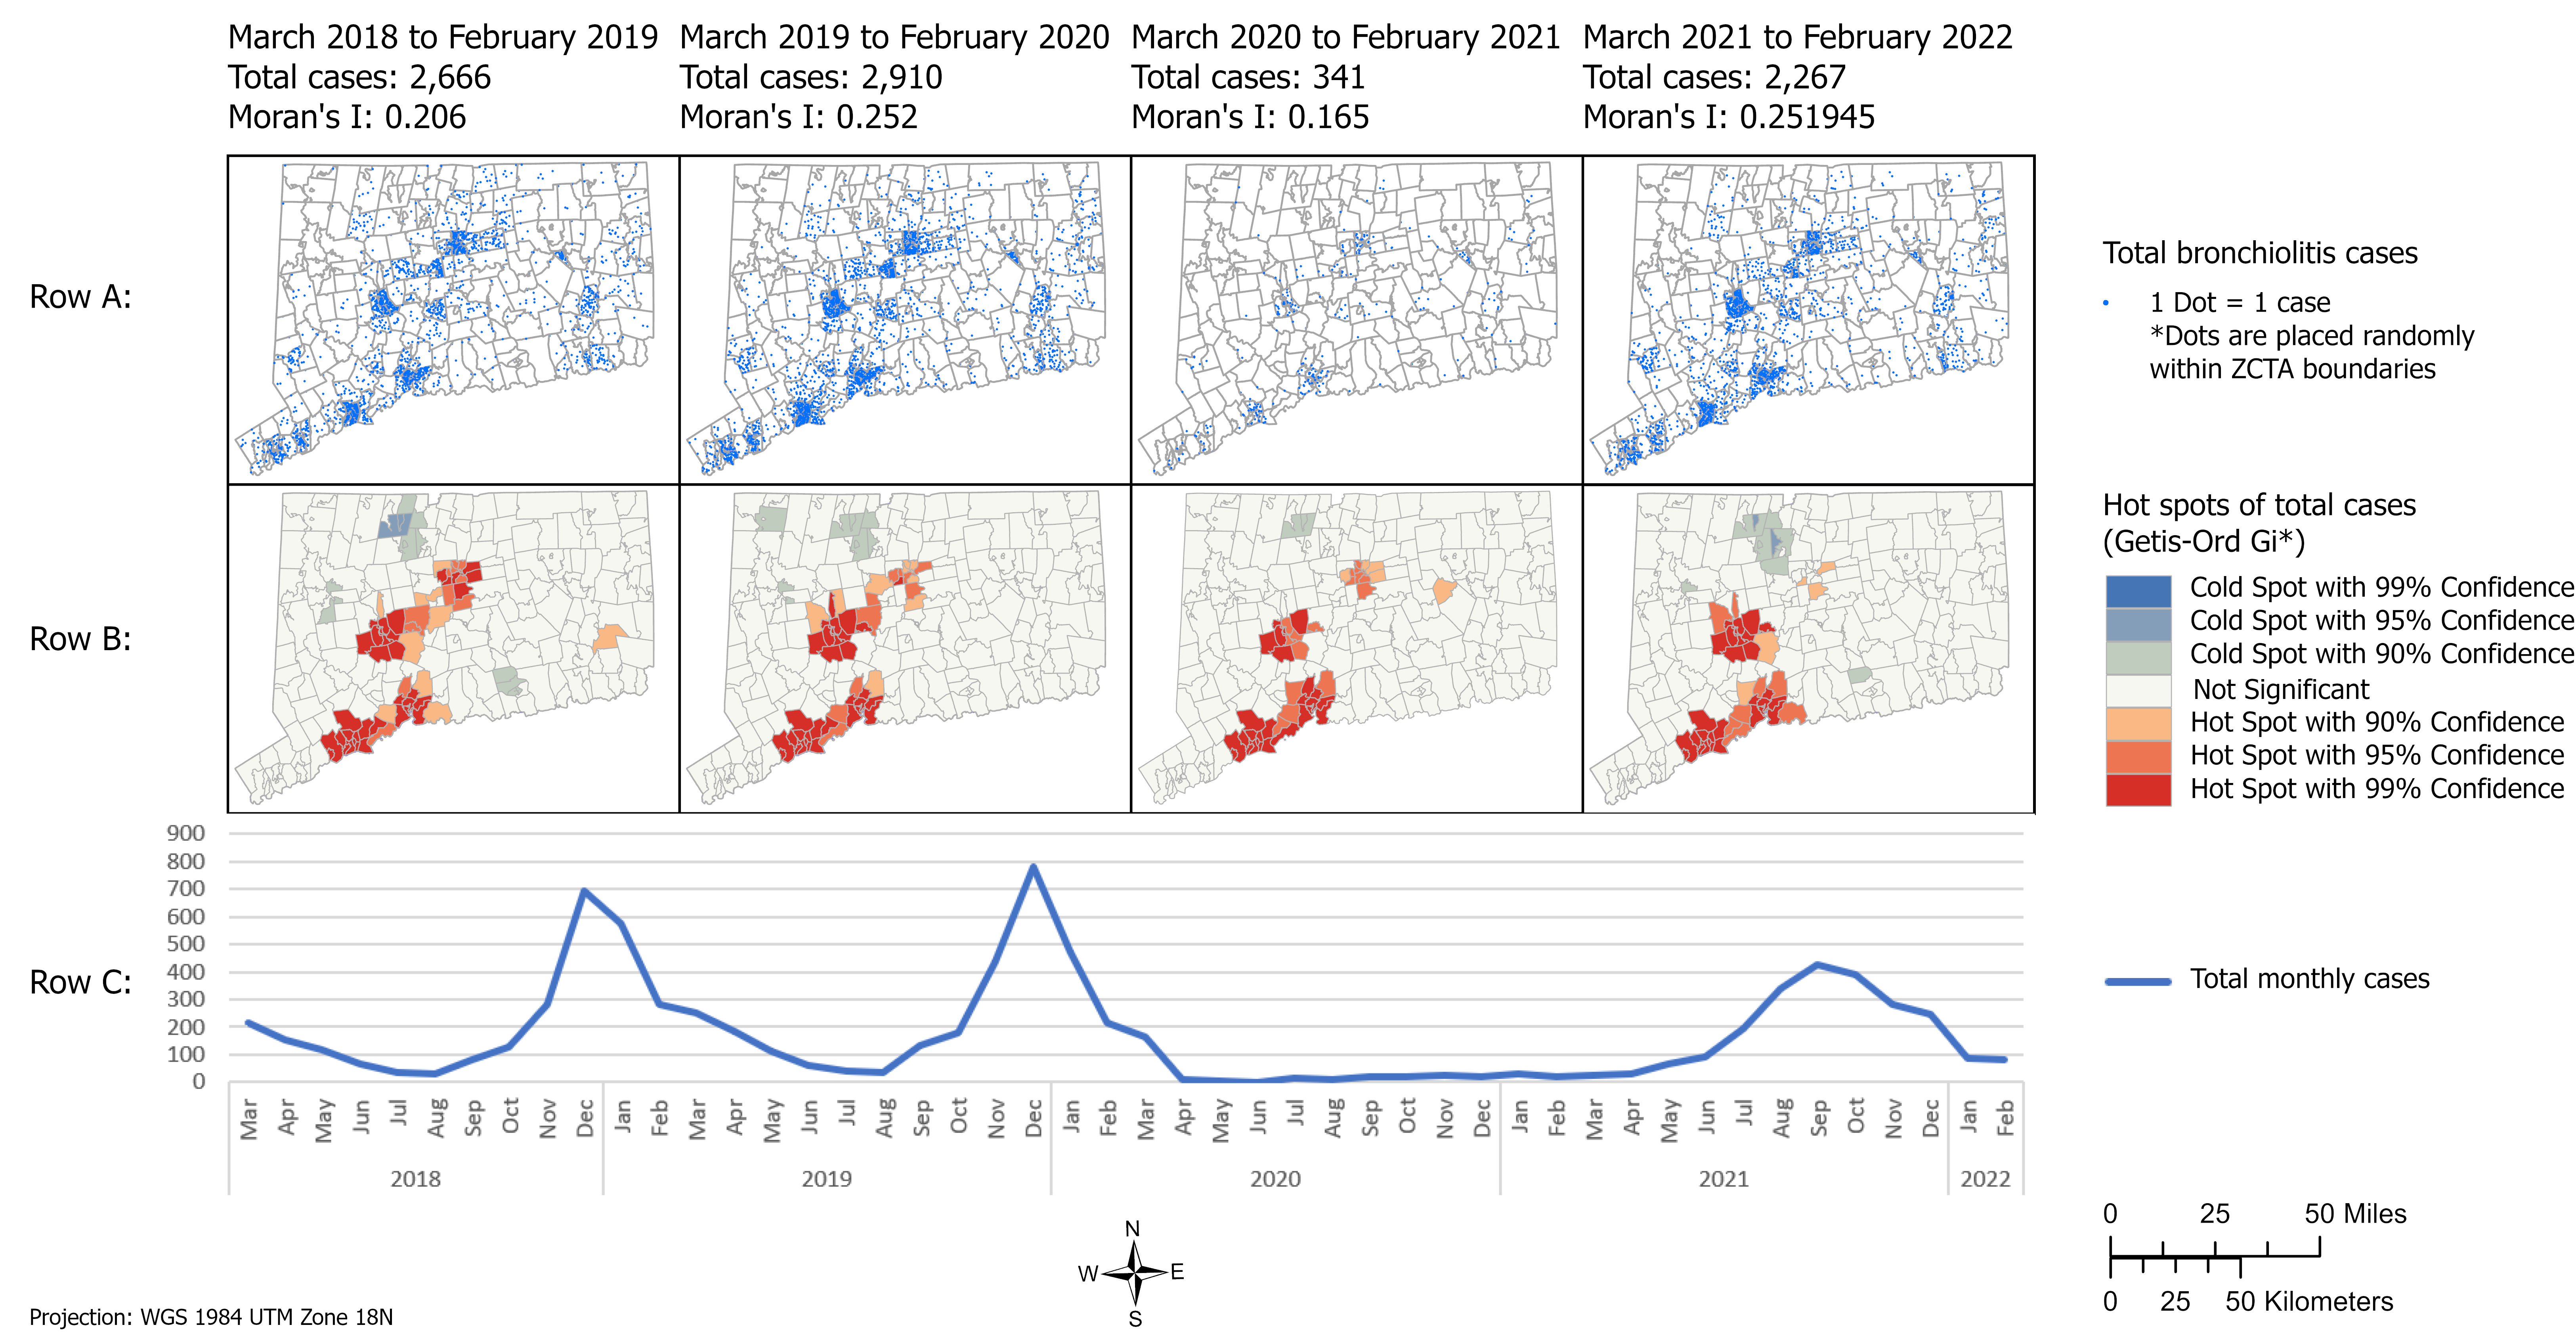
Results: There were 8,184 bronchiolitis emergency and hospital discharges during the study period. Figure 1 demonstrates the raw discharge distributions (Fig 1, Row A), statistical Hot and Cold spots (Fig 1, Row B), and the bronchiolitis monthly encounter count (Fig 1 Row C). Absolute numbers of encounters clustered in ZCTAs with high populations; therefore, we calculated and mapped encounters per ZCTA per 100 children (Fig 2, Row A). Clusters, or Hot Spots, of bronchiolitis encounter rates normalized per population (Fig 2, Row B) persisted with 99% confidence surrounding the city of Waterbury before, during, and after the first COVID-19 pandemic year. SaTScan analysis found relatively stable clusters before and after the first pandemic year in ZCTAs located in Waterbury, New Haven, and Hartford (Fig 2, Row C), three of Connecticut’s largest cities.
Conclusion(s): In a purely spatial analysis, only Waterbury exhibits disproportionate acute care rates. However, policymakers should also consider ZCTAs with elevated raw case rates and geo-temporal clustering when planning immunization promotion campaigns as these methods may most efficiently reach the most infants.


