Critical Care
Session: Critical Care 1
119 - A Comparison of Point-of-Care and Laboratory Electrolyte and Glucose Concentrations in Two Children’s Hospital Emergency Departments
Monday, May 6, 2024
9:30 AM - 11:30 AM ET
Poster Number: 119
Publication Number: 119.3108
Publication Number: 119.3108
- KC
Kelsey A. Clabby, Bachelor of Science
University of Central Florida College of Medicine
Tampa, Florida, United States
Presenting Author(s)
Background: Point-of-care testing (POC) has become increasingly popular in acute care settings to provide timely results in critical care settings. There have been discrepancies noted between POC concentrations and laboratory analyses leading to improper medical decision making. These discrepancies may be secondary to the method of POC testing that incorporates whole blood sampling while laboratory analysis incorporates plasma sampling.
Objective: Although discrepancies are known to exist, there have been few studies comparing glucose and electrolyte concentrations in acutely ill children of which this study aims to investigate.
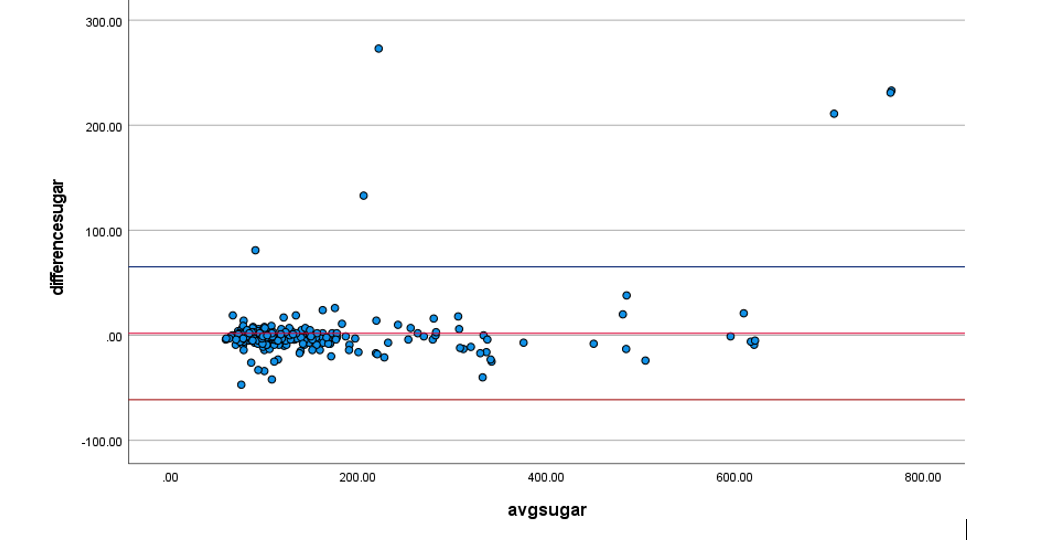
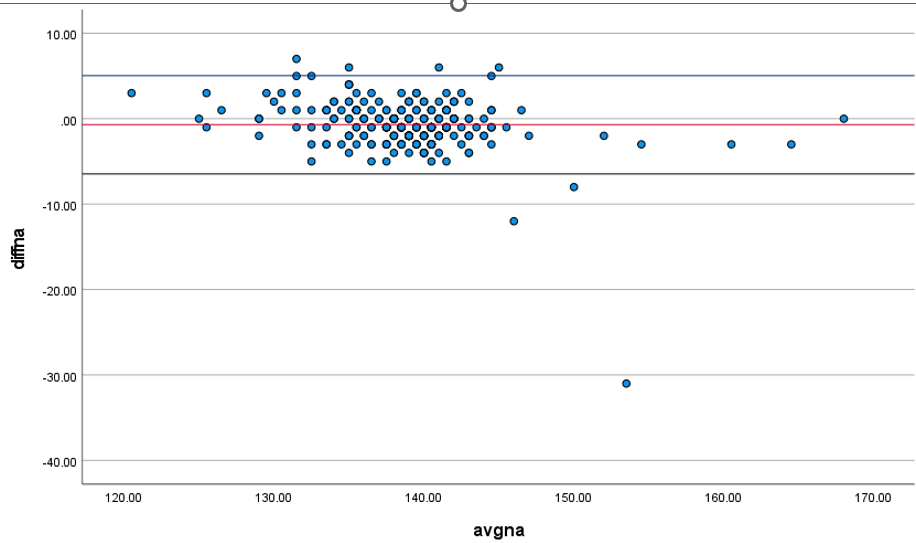
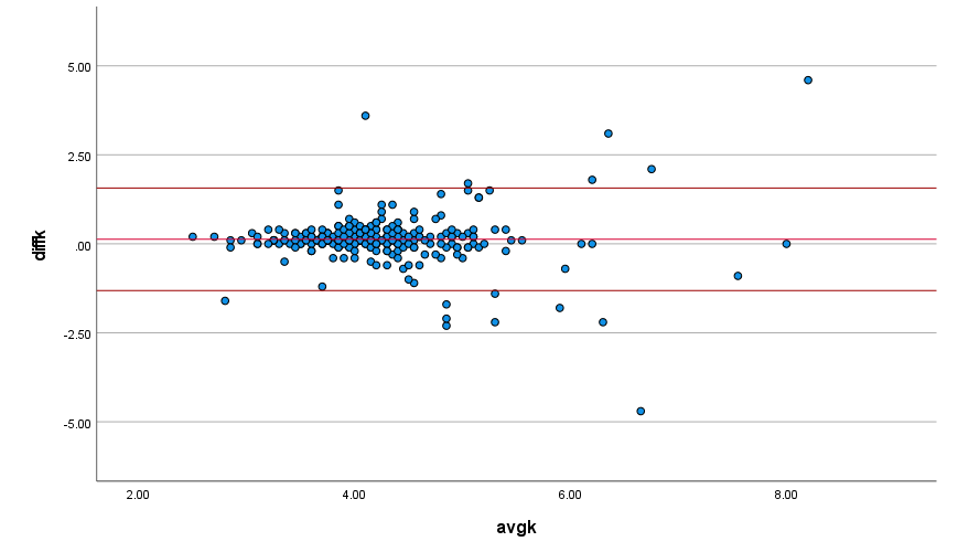
Design/Methods: A chart review was performed of patients aged 0-18 being seen at Nemours Children’s Hospital-Delaware and Nemours Children’s Hospital-Florida that both use i-Stat-1 (Abbott Laboratories, Princeton, NJ) for POC testing and the VITROS 5600 @ NCH-DE and the VITROS 7600 @ NCH-FL (Ortho Clinical Diagnostics, Raritan, NJ) for laboratory analysis. Sodium (mmol/L), potassium (mmol/L), hemoglobin (g/L), and glucose (mg/L) concentrations were measured in 266 patients using POC and laboratory analysis completed within one hour each other were compared. The average difference (bias) + 1 sd (precision) between the concentrations of POC and laboratory testing were compared using paired T-test (mean, standard deviation) and Bland- Altman plots with 95% limits of agreement (LOA) (lower limit, upper limit).
Results: Glucose showed concordance between POC (152.5, 114.2) and laboratory (154.5, 127.2) concentrations along the normal and abnormal ranges (p=0.16). The mean difference for glucose was 1.97 with 95% LOA (-61.3, 65.2). Sodium concentrations between POC (139.3, 5.7) and laboratory (138.6, 4.8) showed discordance (p <.001). The mean difference was -0.69 with 95% LOA ( -6.4, 5.1). Potassium concentrations also showed discordance along the abnormal range between POC (4.2, 0.85) and laboratory (4.3, 0.87, p<.001). Potassium mean difference was 0.13 with 95% LOA (-1.3, 1.6). Hemoglobin concentrations also showed discordance in abnormal ranges between POC (13.2, 2.3) and laboratory (12.6, 2.1, p<.001). The mean difference of hemoglobin concentrations was 0.56 with 95% LOA (-2.7, 1.6).
Conclusion(s): There was significant disagreement of electrolyte concentrations in acutely ill children measured with POC compared to laboratory analysis. Glucose point of care testing was the most precise and unbiased among the concentrations compared. Clinicians should always keep in mind the differences in electrolytes between whole blood sampling with POC and plasma sampling with laboratory analyzers.


